How Much Inflation have we had since 1913?
Just like compound interest, “compound inflation” grows faster and faster. So, even though the average annual inflation since 1913 has been “only” 3.24% PER YEAR. After over 100 years, the total cumulative inflation becomes astronomical.
See Average Annual Inflation Rates by Decade to see how each decade stacked up.
As you can see from the chart below, compounding something for over 100 years at 3.24% will result in well over 2000% inflation. The Consumer Price index (CPI-U) for January 1913 was 9.8. The CPI-U for July 2022 was 296.276. This means that something that cost $9.80 in January 1913 would cost $296.28 in July of 2022!
Cumulative Inflation Chart
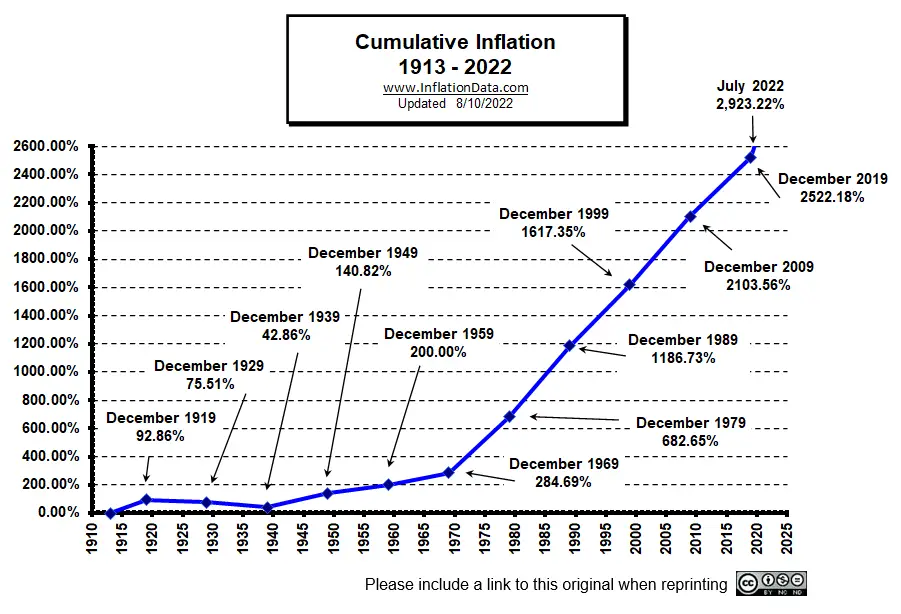
If that isn’t bad enough, the situation is actually worse. Looking at the chart carefully, you will see that inflation was fairly steep during the “teens” from 1913 – 1920. So, in 7 years, prices had already almost doubled. (See: Total Inflation by Decade). But then, during the 1920s and 1930s, inflation declined. The CPI-U index stood at 13.9 in January of 1940.
We would expect prices in the 30s to decline (deflation) because of the depression, but it is surprising that prices also fell during the “roaring 20s“.
Therefore, virtually all of the 2000% inflation occurred since 1940. The average annual inflation rate in the 1940s was 4.86%. In the 1970s, it was 7.25%, and in the 1980s, inflation averaged 5.82%. Each of those decades was especially hard economically for people trying to make ends meet. Since prices increased but wages didn’t keep up. So far in the 2020s, the average annual inflation is 4.75%, so if this continues, we could be in for a rough decade. For more information and a chart, see the average annual inflation rates for all decades since 1913.
Total inflation of 2,900 percent might seem like a crazy number but remember, the original price was $9.90. So, if the price rose to $19.80, you have 100% inflation, and at $29.70, you have 200% inflation, and so on.
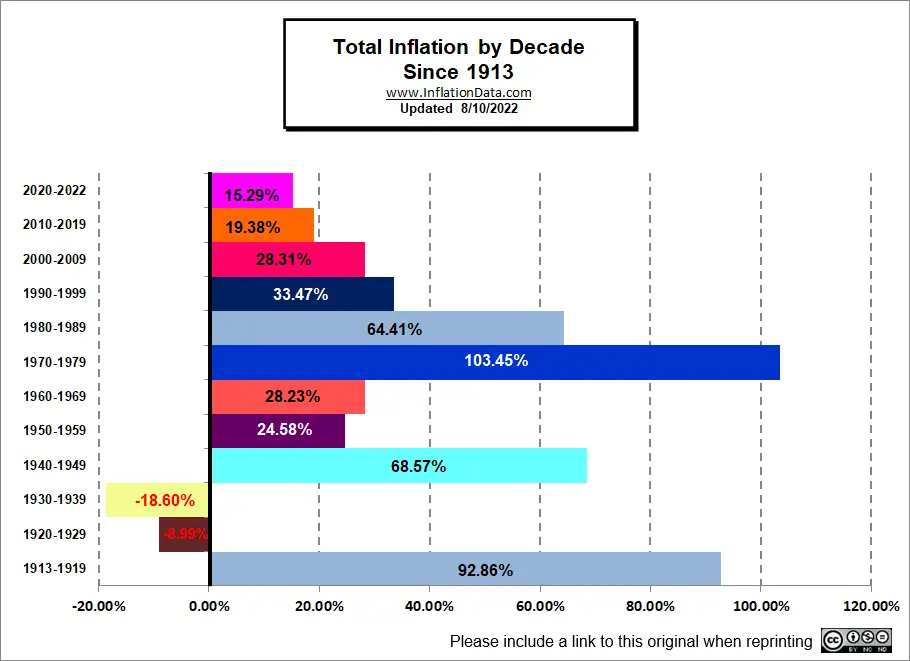
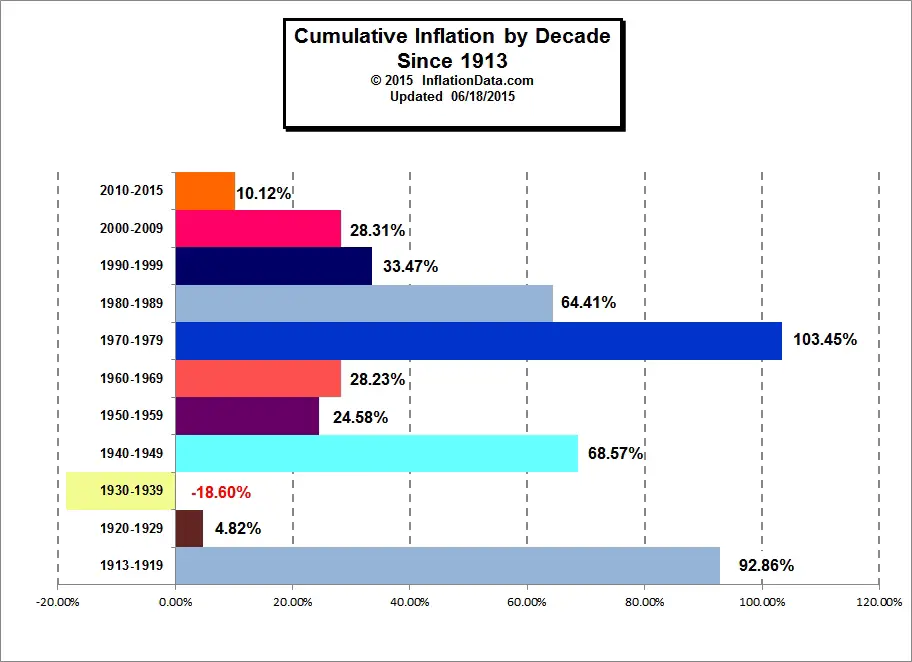
Total U.S. Cumulative Inflation by Decade
Rather than looking at the average inflation for each year in a decade, if we look at the total inflation that piled up during a particular decade, we see that the 1970s were the worst. The teens might have been worse, but we don’t have data for the entire decade. We do know that inflation was already bad enough in 1913 to force the government to start tracking it.
The 1940s and the 1980s were also bad.
As you can see in the first two years of this decade we’ve seen almost as much inflation as in the entire last decade. Also, note that despite the fact that last decade had very low annual inflation prices still increased by almost 20% during that time period. So even very low inflation adds up.
If you want to easily calculate the total cumulative inflation between two specific dates, you can use our cumulative inflation calculator. In addition to telling you how much inflation occurred between those two dates, it will also tell you how much something would cost after adjusting for inflation.
You might also like:
- Inflation and Consumer Price Index- Decade Commentary
- WWI – The beginning of the CPI the Inflationary period 1913 – 1919
- The “Roaring Twenties” Inflation and Deflation 1920-1929
- The Great Depression and the Deflationary 1930′s– 1930-1939
- World War II — the volatile 1940′s– High and Low Inflation 1940-1949
- The 1950′s “Happy Days”– Inflation and CPI 1950-1959
- The 1960′s the age of possibility– Low Inflation 1960-1969
- The Inflationary 1970’s Inflation and CPI 1970-1979
- The Reagan Era Lower Inflation 1980-1989
- Data Source: US Bureau of Labor Statistics
 |
 |
| Average Annual Inflation by Decade | Total Inflation by Decade |

Leave a Reply