Without looking at inflation-adjusted prices it is difficult to see where gasoline prices actually stand. Back in 1918 gasoline was $0.25 a gallon and by 1932 prices had fallen to 18 cents a gallon! But as we all know over the last 100 years the purchasing power of the dollar has fallen drastically. So, in order to get the true picture, we can’t just say that the lowest price of gas was 18 cents per gallon, we need to adjust the price for inflation. When adjusting for inflation there are two prices… the first is called the “nominal price” and that is the actual price you would have paid for gas at the pump i.e. 18 cents. The key price though is the inflation-adjusted price which calculates what the price would have been if we were spending current dollars on a previous date. In this case, we are basing our calculations on the value of a dollar in April 2022.
 In other words, imagine taking today’s dollars and jumping into a time-traveling DeLorean and going back to a specific date in time. As you travel back in time, each dollar you bring with you shrinks based on the equivalent purchasing power of that time. The inflation-adjusted price (aka. the price in “real dollars”) is how much you would have to pay back then, using the weakened purchasing power of today’s dollar. So if overall prices have doubled over a specific time period it would take two inflation-adjusted dollars to buy something that only cost one dollar, back then.
Lowest Inflation-Adjusted Price of Gasoline–
$1.80 in 1998
| Date | Inflation-Adjusted Lows |
| 1931 | $3.23 |
| 1947 | $2.98 |
| 1972 | $2.49 |
| 1998 | $1.80 |
| 2009 | $3.11 |
| 2016 | $2.49 |
| 2020 | $2.31 |
Looking at the table above it is interesting to note that both 1972 and 2016 bottomed at roughly the same inflation-adjusted price even though the nominal price was drastically different.
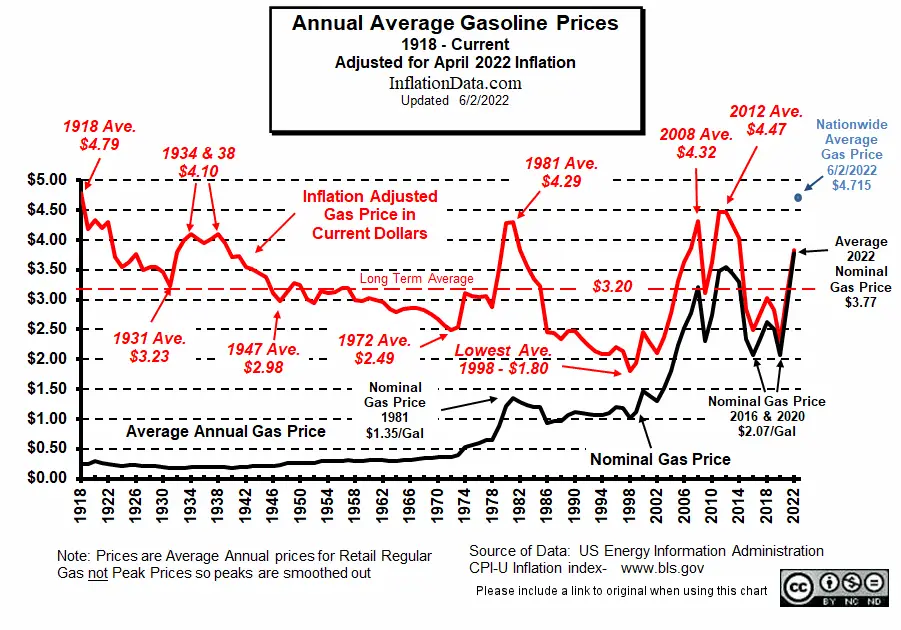
If we look at the chart below we see that in inflation-adjusted terms, the first low occurred in 1931 as nominal prices fell from 30 cents a gallon in 1920 to 17 cents in 1931. Thus in 11 years prices fell 43%. But we have to remember that 1931 was the beginning of the “Great Depression” and overall prices fell 24% during the same period. As we can see gasoline prices fell much more than prices in general in the early portion. It is noteworthy that in 2016 prices for gasoline on an inflation-adjusted basis were actually much lower than they were during the Great Depression.
Since 2016, prices ticked up a bit but then made another bottom in 2020. Although as of this writing gas prices are well over $4/gallon nationwide and over $6.00 in California. The nationwide average for Regular gasoline for 2022 so far is “only” $3.77 (but it is still early).
 Click for Larger Image
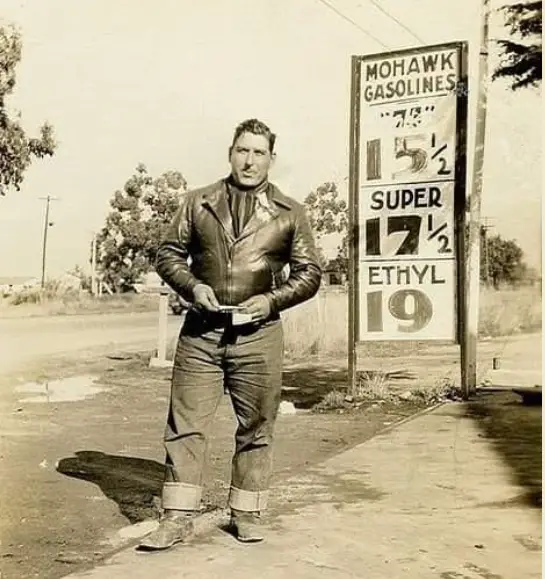
Gasoline in the Great Depression
During the remainder of the 1930s inflation-adjusted prices rose to the equivalent of $4.10/gallon in 1938 with the nominal price of 20 cents a gallon. The rise in inflation-adjusted prices is actually due to overall deflation making the adjusted price look higher even though the nominal price remained the same. In 1929, gas was 20 cents a gallon and it fell to 17 cents a gallon in 1931 before climbing back to 20 cents a gallon. Of course there were some regional variations in price and 20 cents was the average.
Gasoline Prices in the 1940s -50s
In 1940, nominal prices dipped back to 18 cents a gallon, bringing the inflation-adjusted price down to $3.72. From there, gasoline prices actually rose, but inflation rose faster due to WWII, so the inflation-adjusted price of gas appeared to fall, but due to wartime rationing, gasoline was not always available at that price. The next bottom occurred in 1947 as inflation-adjusted prices had fallen to $2.98, with nominal prices back up to 1926 levels of 23 cents a gallon.
By 1949, just two years later, nominal prices had climbed to 27 cents a gallon (a 17% increase), and inflation-adjusted prices were $3.28/gal. From 1950 through 1959, nominal gas prices climbed from 27 cents a gallon to 30 cents a gallon, with a brief stop at 31 cents a gallon in 1957. But over the same period, overall inflation climbed faster, so the inflation-adjusted price actually fell from $3.24 in 1950 to $2.98 in 1959.
Gasoline Prices in the 1960s -70s
From 1960 through 1965, nominal gas prices bounced between 30 and 31 cents a gallon while the inflation-adjusted price fell from $3.03 to $2.85. But then the nominal price of gas started to climb and by 1970 had increased 20% to 36 cents a gallon, but on an inflation-adjusted basis, gas prices had actually fallen to $2.68. And by 1972, gas on an inflation-adjusted basis was a real bargain at $2.49 a gallon.
At this point, OPEC felt they were being cheated as the value of the dollars they were receiving was becoming worth less and less. So they started squeezing prices, which drove nominal prices in 1981 up to $1.35 and inflation-adjusted prices up to $4.29. Note that this price was higher than the price during 1934 and 38 but below the 1918 price.
From there, nominal prices fell moderately over the next 17 years, and inflation itself moderated, falling from 13.5% in 1980 to 1.86% in 1986 and then increasing to 4.82% in 1989. This resulted in drastically cheaper gas on an inflation-adjusted basis, with the lowest recorded inflation-adjusted price for gas occurring in 1998 at $1.80 per gallon.
In 1998, overall price inflation made it look like gasoline prices were rising, so most people didn’t realize that gas was actually cheap on a historical basis. But they knew it intuitively since a smaller portion of their budget was going toward gasoline. In fact, gas had gotten really cheap by historical standards allowing people to buy gas guzzlers like SUVs and Hummers.
Gas Price Peaks
| Date | Inflation-Adjusted Highs |
| 1918 | $4.79 |
| 1934 | $4.10 |
| 1938 | $4.10 |
| 1981 | $4.29 |
| 2008 | $4.32 |
| 2012 | $4.39 |
Note: Remember these are annual average prices for regular “conventional” motor fuel. Some states require “reformulated” fuel which would cost more. Some states also impose higher-than-average taxes on gasoline, so prices will be higher in those states. Also, Mid-grade and Premium fuel will also cost more. Plus, since these are “annual average” prices, half-of-the-year prices will be higher, and half-the-year prices will be lower (sometimes with considerable variation over the 12 months).
On an annual average inflation-adjusted basis, gasoline prices have tended to peak in the same range over the entire 96-year price history. Back in 1918, as gasoline was just entering commercial production, prices were at their peak at $4.79, but as refining capacity improved, prices began to fall (in both nominal and inflation-adjusted terms).
In the early 1930s, demand for gas fell, and so did prices, but as overall deflation took hold, the inflation-adjusted price peaked at $4.10 in 1934 & 1938.
The next peak occurred during the mid-1930s, and then there was a long period of relatively low gas prices, so the rapid increase in the late 1970s was a major (and somewhat artificial) shock to most people who saw nominal prices rocket above $1.00/gal. for the first time ever. Most did not realize that on an inflation-adjusted basis, the last time prices were this high was during the Great Depression (not that the thought would have brought much comfort).
Recent Gas Price Action
Over the next 20 years, people in the United States once again got used to low gasoline prices. And then, from 2002 to 2008, prices for gas once again climbed to previous peak levels on an inflation-adjusted basis. From there, the stock market crash brought some relief in gas prices as virtually everything fell in price. But relief did not last long, and by 2012, gas prices were once again at peak levels.
In late 2014, OPEC started a “price war” in response to the United States’ increased production due to fracking, and prices fell drastically. In 2016, prices fell below the 1931, 1947, and 1972 lows 9in inflation-adjusted terms). In the ensuing years, increased production due to fracking allowed the U.S. to become energy independent and the biggest oil and natural gas producer on the planet. An interesting article by NPR: How An Engineer’s Desperate Experiment Created Fracking.
Biden’s Impact on Gas Prices
On his first day in office, Joe Biden halted completion of the Keystone XL pipeline via Executive Order. Ironically, the Keystone XL would have been the world’s first zero-emission energy pipeline. Simultaneously, he placed a “temporary” ban on drilling in ANWR, which would have increased the use of the Alaskan pipeline. His Executive Order also halted energy development on federal land and shut down the 80 million-acre oil lease sale putting the Louisiana oil and gas industry in danger. So with the stroke of a pen, he eliminated U.S. energy independence.
The oil and gas business is a very capital-intensive business, and huge amounts of new capital are required to explore and drill for oil. But due to the anti-oil and gas policies of the Biden administration, large banks, and other investors are reluctant to risk capital on oil exploration since the project could be halted mid-stream by government fiat.
Instead of buying oil from friendly neighbors like Canada, the Biden administration is courting countries like Saudi Arabia, Venezuela, and Iran, placing the U.S.’s energy situation on an even more unstable footing.
Russian Oil
To make matters worse, these costly policies were followed by Russia’s invasion of Ukraine. Russia is the world’s third-largest oil and gas producer, producing about 10 percent of the world’s oil and 40 percent of Western Europe’s natural gas. So, when the West embargoed Russian oil, it drastically reduced the available supply for Western Countries.
The obvious result has been skyrocketing gas prices.
The average inflation-adjusted gasoline price since 1918 in “April 2022 dollars” is $3.20, so whenever inflation-adjusted gasoline prices were above $3.20, they were “high”, and whenever prices were below $3.20, they were “low”. From the table below, we can see that 2014 had above-average prices, and then every year from 2015 through 2021, gasoline prices have been “below average”.
| Year | Nominal Price |
Inflation-adjusted Price |
| 2014 | $3.30 | $4.03 |
| 2015 | $2.33 | $2.85 |
| 2016 | $2.07 | $2.49 |
| 2017 | $2.33 | $2.75 |
| 2018 | $2.63 | $3.03 |
| 2019 | $2.50 | $2.83 |
| 2020 | $2.58 | $2.31 |
| 2021 | $2.91 | $3.10 |
| 2022 (Partial Year) | $3.35 | $3.82 |
Perspective
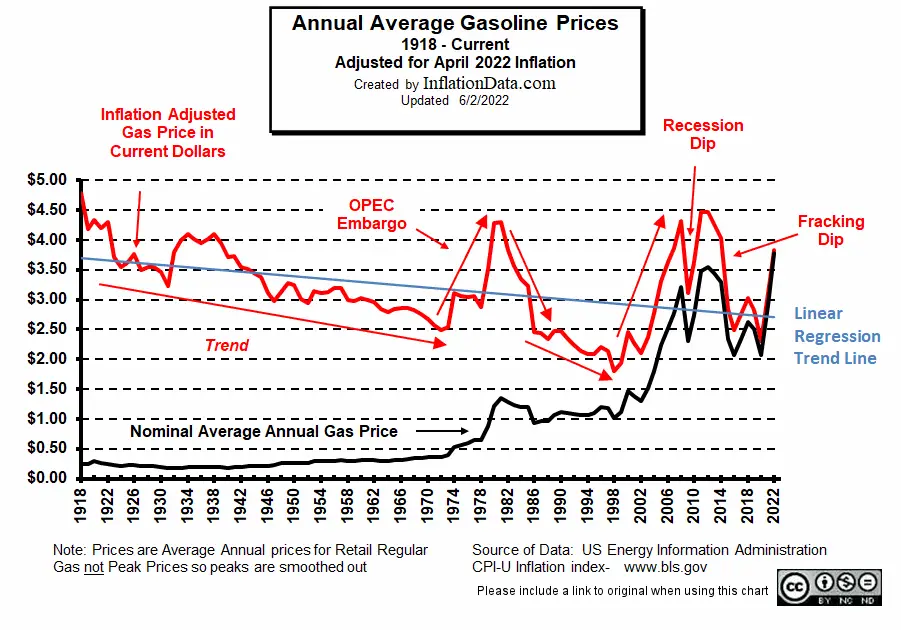
When we look at gas prices from our own personal perspective, we only see a small window of 4 or 5 years at most. Rarely do we even consider a 10-year time frame. Therefore, we might assume that gas prices “always go up.” But if we look at the big picture in inflation-adjusted terms, we will get quite a different picture, as we can see from the chart above. Yes, the black “nominal price” was continually rising through about 2006, but even in nominal terms from 2012 through 2020, we saw a pretty significant decline.
If we look at gas in inflation-adjusted terms, except for a few short-term spikes, it was actually trending downward from 1918 through 1972. Which is to say that the cost of living based on other things increased in price more than gasoline over that period. From 1972 through 1981, prices moved up sharply, and by 1980-81 everyone was suffering from sticker shock as nominal gas prices rose above $1.00 for the first time, but then gasoline resumed its downward trend.
Due to pressure from the Arab oil embargo, from 1970-1980, gasoline regained almost all it had lost over the previous 50 years. Then from 1980 – 2000, gasoline fell to new lows on an inflation-adjusted basis. But from 2000-2006, gasoline caught back up with other prices and was back where it was in 1918. Then the 2008 recession hit, and worldwide demand slowed, and prices fell sharply but quickly rebounded with fears of “peak oil”.
But then, technological improvements due to hydraulic fracking allowed the price to drop both in nominal and inflation-adjusted terms, although overproduction caused a reversal in 2016. Since then, the industry has leveled out, and prices have stabilized. Over the longest term, we can see that the linear regression line has actually been trending down since 1918.
| Year |
Average Nominal |
Inflation-Adjusted Gas Prices Adj. for April 2022 |
| 1918 | $.025 | $4.79 |
| 1919 | $0.25 | $4.18 |
| 1920 | $0.30 | $4.34 |
| 1921 | $0.26 | $4.20 |
| 1922 | $0.25 | $4.30 |
| 1923 | $0.22 | $3.72 |
| 1924 | $0.21 | $3.55 |
| 1925 | $0.22 | $3.63 |
| 1926 | $0.23 | $3.76 |
| 1927 | $0.21 | $3.49 |
| 1928 | $0.21 | $3.55 |
| 1929 | $0.21 | $3.55 |
| 1930 | $0.20 | $3.46 |
| 1931 | $0.17 | $3.23 |
| 1932 | $0.18 | $3.80 |
| 1933 | $0.18 | $4.00 |
| 1934 | $0.19 | $4.10 |
| 1935 | $0.19 | $4.01 |
| 1936 | $0.19 | $3.95 |
| 1937 | $0.20 | $4.02 |
| 1938 | $0.20 | $4.10 |
| 1939 | $0.19 | $3.95 |
| 1940 | $0.18 | $3.72 |
| 1941 | $0.19 | $3.74 |
| 1942 | $0.20 | $3.55 |
| 1943 | $0.21 | $3.51 |
| 1944 | $0.21 | $3.45 |
| 1945 | $0.21 | $3.37 |
| 1946 | $0.21 | $3.11 |
| 1947 | $0.23 | $2.98 |
| 1948 | $0.26 | $3.12 |
| 1949 | $0.27 | $3.28 |
| 1950 | $0.27 | $3.24 |
| 1951 | $0.27 | $3.00 |
| 1952 | $0.27 | $2.95 |
| 1953 | $0.29 | $3.14 |
| 1954 | $0.29 | $3.12 |
| 1955 | $0.29 | $3.13 |
| 1956 | $0.30 | $3.19 |
| 1957 | $0.31 | $3.19 |
| 1958 | $0.30 | $3.00 |
| 1959 | $0.30 | $2.98 |
| 1960 | $0.31 | $3.03 |
| 1961 | $0.31 | $3.00 |
| 1962 | $0.31 | $2.97 |
| 1963 | $0.30 | $2.83 |
| 1964 | $0.30 | $2.80 |
| 1965 | $0.31 | $2.85 |
| 1966 | $0.32 | $2.86 |
| 1967 | $0.33 | $2.86 |
| 1968 | $0.34 | $2.82 |
| 1969 | $0.35 | $2.76 |
| 1970 | $0.36 | $2.68 |
| 1971 | $0.36 | $2.57 |
| 1972 | $0.36 | $2.49 |
| 1973 | $0.39 | $2.54 |
| 1974 | $0.53 | $3.11 |
| 1975 | $0.57 | $3.06 |
| 1976 | $0.60 | $3.05 |
| 1977 | $0.64 | $3.05 |
| 1978 | $0.65 | $2.88 |
| 1979 | $0.88 | $3.50 |
| 1980 | $1.22 | $4.28 |
| 1981 | $1.35 | $4.29 |
| 1982 | $1.28 | $3.83 |
| 1983 | $1.23 | $3.57 |
| 1984 | $1.20 | $3.34 |
| 1985 | $1.20 | $3.22 |
| 1986 | $0.93 | $2.45 |
| 1987 | $0.96 | $2.44 |
| 1988 | $0.96 | $2.35 |
| 1989 | $1.06 | $2.47 |
| 1990 | $1.12 | $2.48 |
| 1991 | $1.10 | $2.34 |
| 1992 | $1.09 | $2.24 |
| 1993 | $1.07 | $2.13 |
| 1994 | $1.07 | $2.09 |
| 1995 | $1.10 | $2.09 |
| 1996 | $1.19 | $2.20 |
| 1997 | $1.19 | $2.14 |
| 1998 | $1.02 | $1.80 |
| 1999 | $1.12 | $1.94 |
| 2000 | $1.46 | $2.46 |
| 2001 | $1.39 | $2.27 |
| 2002 | $1.31 | $2.10 |
| 2003 | $1.51 | $2.38 |
| 2004 | $1.81 | $2.77 |
| 2005 | $2.24 | $3.31 |
| 2006 | $2.53 | $3.63 |
| 2007 | $2.77 | $3.86 |
| 2008 | $3.22 | $4.32 |
| 2009 | $2.31 | $3.11 |
| 2010 | $2.74 | $3.64 |
| 2011 | $3.48 | $4.47 |
| 2012 | $3.55 | $4.47 |
| 2013 | $3.44 | $4.27 |
| 2014 | $3.30 | $4.03 |
| 2015 | $2.33 | $2.85 |
| 2016 | $2.07 | $2.49 |
| 2017 | $2.33 | $2.75 |
| 2018 | $2.63 | $3.03 |
| 2019 | $2.50 | $2.83 |
| 2020 | $2.07 | $2.31 |
| 2021 | $2.91 | $3.10 |
| 2022 | $3.77 | $3.82 |
Data Sources:
You might also like:
- Annual Inflation Chart
- Gasoline vs. Crude Oil Prices
- Historical Gas Price Chart
- Current Average Cost of Gas by County
- Gasoline Taxes by State
- Average Cost of Gas Per Month
- Calculating Miles Per Gallon
- Regarding Gas Inflation
- Historical Oil Prices Chart
- More Inflation Adjusted Prices
- Crude Oil and Gold
- Oil, Petrodollars and Gold

It’s so strange to me, that even when evidence is laid out before them, leftist still refuse to accept the truth. Continually blame Republican presidents – when in every case they saved the country from the Democrat that just about destroyed it! This administration with a senile old man is an embarrassment and disgrace. And middle class are about to be bankrupt because of him. His wife should be ashamed watching her stumbling husband attempts at running a country! Every single person who voted for him should be ashamed!
There must be something that you said that I don’t because as far as I’m concerned and I followed a decade he is everything that they say about him and leaving work is Despicable the only thing I can figure out is that you’re missing form to a degree that is unreal
Probably because we can actually read, think, and count.
Keystone was the dirtiest pipeline ever planned. The oil wasn’t for the US. The tar pit it comes out of is too dirty to refine profitability in North America.
It’s interesting to note that according to the Wall Street Journal the Keystone Pipeline would have been the first “Zero Emission Pipeline” i.e the cleanest pipeline and a lot cleaner than hauling oil around on trains.
https://www.wsj.com/articles/keystone-xl-oil-project-pledges-zero-carbon-emissions-11610930642
The pipeline itself may not have had emissions, but the oil it was designed and planned to carry is some of the dirtiest in the world.
Those two cannot be separated. If the only thing the worlds first zero emissions pipeline can do is carry the worlds dirtiest oil, it is automatically dirty, regardless of the fact that the operation of the pipeline itself does not produce emissions. The best possible outcome would be to banish that oil from entering the U.S. all together, especially since it is only being refined here for export and doesn’t benefit us at all.
The thing is, we are in the last decade or two of oil being the dominant fuel in the world. By 2030-2035 the EU, the UK and a few other countries are banning new sales of combustion powered vehicles, which will have a drastic impact on global demand. Expending large resources on expanding oil today is foolish, especially since new exploration has a long lead time before it comes online, by which time demand should be dropping.
Fusion is also right around the corner. MIT Spinoff “Commonwealth Fusion Systems” is currently constructing what they believe will be the worlds first commercially producing fusion plant in Devens, MA (former Fort Devens) and due to come online in 2025, using fuel that is practically free, hydrogen generated from a few quarts of sea water per year, and produces little in the way of waste, mostly just Helium you could use to fill balloons! It’s not science fiction anymore! It’s actually being built using investor money.
The world is about to change drastically, and it seems more and more unlikely a majority of us will be driving around internal combustion vehicles in 20 years time, so why make decades long investments in oil in order to reduce gas prices when those investments will be starting to go obsolete as soon as they come online? No business in their right mind would do that.
Matthew,
I wrote an article way back in the 1980s about the wonders of Fusion and how it was the next great energy source. It has certainly taken longer than I expected to gain traction.
In addition, and regarding the authors response to your comment:
An obvious hinderance to fusion tech would certainly be legislation or gov policy which did not support its field of research, if you don’t put in the time or effort in the new and continue with 100 yr old bad habits then it should come as no surprise the tech is progressing slower than you predicted 20+ yrs ago, this is a weak position in arguing the legitimacy of new tech.
Yes, let’s talk evidence! Please take note that A. 2008 Bush was president, meaning the one of the highest price points belongs to a modern Republican POTUS, B. the Obama Administration’s Cabinet and EPA both signed off on the fracking boom that lowered prices to HISTORICAL lows both nominally and inflation adjusted during his administration, and C. Trump negotiated a 9 million BPD production cut in March of 2020 due to COVID that OPEC was forced to agree to in order to protect US production, which isn’t a bad thing for US companies, but it’s always harder to recover production than sustain it. We are almost back to February 2020 levels of production. We had record oil production in the US alone this past month. And with that, the Saudis are finding Aramco is unprofitable and will have to likely boost output to fund their economy, and that will likely put downward pressure on prices in the coming year.
Thanks, Biden!
Yep, Bush2 presided over one of the biggest buildups in the strategic petroleum reserves as did Reagan and Bush1 while reserves have been slowly drawn down since 2010, with only a slight blip up under Trump. And now Biden has used those reserves not for strategic purposes but to buy votes with lower gas prices. I wonder what will happen if Iran decides to close the straits of Hormuz and we actually need all that oil?
https://inflationdata.com/articles/wp-content/uploads/2023/11/SPR-Chart-Aug-2023.png
As someone who remembers $0.33 p/gal gas prices pre-OPEC embargo days, I really enjoyed this article.
Except for your phrase, “So with the stroke of a pen, he (Joe Biden) eliminated U.S. energy independence.”
We were not poised to be ‘energy independent’ in 2020–or ever at the current rate of progress & demand–not really.
We consume more oil per capita than any country on earth & our appetite is never satisfied.
You wrote it yourself when you mentioned the gas-guzzling SUVs as the US response to lower fuel prices in the ’90’s.
Until we conserve fuel the way Americans did during WW2 & until we use every bit of energy-saving technology available (HEVs, cars that run on recycled products, better MPG vehicles, & yes–even dreaded EVs) we will never be ‘energy independent’–and the world oil producers know it!
Again–great article–thank you for your work.
Agree, the author doesn’t seem to know much about the oil industry. First, Trump was foolish to leave the Iran deal. Now they are further along with nukes and the world could’ve used their oil. Drilling is up 60% under Biden. Biden is pushing EVs and hybrids as well as fuel efficiency standards which in the long term reduces the dependence on oil. Hopefully this year the world will produce 10 million EVs which will reduce the world need for oil by 2 million barrels per day. EVs are the only sure way to reduce oil prices over the long term. We are in a commodity supercycle. There is underinvestment in oil not because of ESG, but because oil investments have sucked for 8 years and price spike like this typically reverse and investors know that history. There’s not a lot of spare capacity in the world especially with the Russian hot/cold war so getting Venezuela to produce makes sense as they are the less of many evils. Better that Biden appeal to them compared to Trump kissing Kim Jung Un’s ring.
From a production worker in a refinery on the Gulf of Mexico: “You’ve been lied to by the President and his phony cronies, but I want to set the record straight. I’m going to tell you the truth, so pay attention”….
1. There is enough recoverable crude oil within the continental US to supply current and projected future demand for 400+ years, and that’s just the oil we know about. It doesn’t account for future discoveries. That’s a fact…
2. We do not need to import a SINGLE DROP of foreign crude oil. The domestic oil industry can easily meet, and even surpass domestic demand. We’ve done it before, and we can do it again. That’s a fact…
3. The domestic oil industry currently cannot satisfy domestic demand due to oil drilling restrictions imposed by the federal government. That’s a fact…
4. The price of EVERYTHING revolves around oil, and the law of supply vs demand dictates the price of oil. When oil is plentiful, commodities are cheap. When oil is scarce, commodities are more expensive. Right now, domestic oil is scarce, and the price of everything is high because of these restrictions imposed by the federal government. That’s a fact…
5. We import foreign oil from countries that drill and produce it much cheaper than we’re able to because they do not implement all of the environmental safeguards that we do. Their methods are FAR more destructive to the environment than ours are. That’s a fact…
6. Every year, the federal government leases tracts of land to oil companies so they can explore on it for oil. If enough oil is found during exploration, the company can then apply for a drilling permit which allows them to drill a well. If no oil is found during exploration, or if the amount found is not enough to be profitable the lease expires without ever being drilled on. Leases that are active, but not being drilled on does NOT mean that oil companies are being lazy, or are trying to keep the oil for themselves, etc. etc. It means they’ve either explored the lease for oil and found nothing, or found oil but it’s not enough to justify drilling for. That’s a fact…
7. it’s not Russia’s fault, or China’s fault, or Ukraine, or India, or Venezuela, or Iran, or Bangladesh, or any other countries’ fault as to why everything is so expensive right now. It’s Joe Biden’s fault, because he is suppressing the domestic oil industry for political gain. EVERYTHING depends on crude oil… but you might not know that if you believe the lies that are being told about oil and the oil industry.
Dennis I’ll reply do your comments. There’s many reasons why gas & oil are higherand it does include every country in the world .includes the printing of dollars that you probably receive a stimmy check. And also has been parked to play prices are going to go much much higher than they are today.I also take it that you’re a republican a right-winger because blaming Biden makes no sense. Many blame closing of Key stone if they could..
Yeah, half of what you told is absolutely and probably false. Oil majors are not investing in drilling now even within leases that remain available. They are doing this to expand profits and reduce capital costs, driving inflation and robbing Americans in the process. This has nothing to do with federal regulations and everything to do with oil company’s greed. For example, Shell Oil just reported Q3 2022 profit of $9.45 billions. Q3 2021 profit was $4.1 billion. Are they using these profits to increase drilling in already approved leases? No, they are using it for stock buy backs.
So cry me a river about how federal government isn’t allowing the oil majors to drill. They aren’t even using the leases they currently have.
Sir; if you’re going to come here to this site and use logic and fact I don’t think you belong here.
Since this is an inflation page, just keep in mind that 33 cent gas in the mid 60’s is equivalent to $3.13 today (per CPI-u)
USA is also the largest producer of oil in the world for the last decade, thanks to fracking, horizontal drilling and other techniques.
What the “world’s energy producers” know is that their market is increasingly India and China and not the USA (or Western Europe).
I see a lot of comments on Facebook stating that European gas prices are even higher than ours. However, I also read somewhere that Europe has always paid more for gas than the United States. Would you be able to show a chart over time comparing US gas prices to European gas prices?
I see a lot of comments on Facebook stating that European gas prices are even higher than ours. However, I also read somewhere that Europe has always paid more for gas than the United States. Would you be able to show a chart over time comparing US gas prices to European gas prices?
You are right, historically Europe has paid significantly more for gas than we do. But they drive smaller cars and everything is closer together, so as a percentage of their income it may be equivalent.
I’m going to answer this question without doing any research First of all Europe is composed of many different countries each country has its own body that determines the price of gas usually the amount that they charge tax on the gas is considerably higher than we do here in the United States. Somehow you seem to give the impression that Europeans are don’t make as much money as people who. live in states and I don’t believe it to be true either when you combine wages and benefits I know it’s not true.
In addition we have varying minimum wages and a big variance in states has taxes on gas making comparison for the nation very difficult. California has high gas taxes an high minimum wages. You can’t compare them with, say Alaska that has no Gas tax.
In addition we have varying minimum wages and a big variance in states has taxes on gas making comparison for the nation very difficult. California has high gas taxes an high minimum wages. You can’t compare them with, say Alaska that has no Gas tax.
Would like to see this updated with current data. And links to actual sources/functions to do offline additional manipulation and graphing, such as raw and inflation-adjusted prices over time overlayed with presidential terms. The eia.gov site has some good info, but only has prices going back to ’93 and does not adjust for inflation.
Some of the older data came from the eia before they removed it from their site. I too was disappointed that they decided to remove it for some strange reason. Fortunately, I had made a copy years ago.
I believe there’s a mistake on the first chart, where you have the arrow pointing to the inflation-adjusted peak, the “2012 Ave. $3.99”. Based on your other information, I believe it should be $4.39?
Good Catch! Thanks! I’ve fixed the chart. But I will have to update the entire chart with all new numbers soon.
I was curious about the price of gasoline recently to actual costs [including inflation]. Some of the wells [crude] were drilled decades ago. Is the price today justified? Or what should gasoline be selling for without ‘greed’ or ‘because we can’t’. Its academic to me as I have an EV I charge at Home with Solar panels.
George, That is a good question. As we can see from the chart Gasoline prices fluctuate wildly (even when adjusted for inflation). The major factors influencing the price of any fungible commodity is supply and demand. In the real world “greed” has nothing to do with it. Although everyone tries to maximize profits if a competitor has the supply he can undercut your price and sell more of his product thus maximizing his profit. This competition drives price to the perfect balance between supply and demand. The economy is roaring ahead (due to the monetary stimulus of the last few years). So demand is high… but a variety of factors have put a damper on supply including “environmental” restrictions created by our government, embargoes on Russian oil etc. So the combination of all these factors has driven gasoline prices up toward the top of the inflation adjusted price range.
So we are, especially now in 2020, paying almost half the cost of a gallon of gasoline! Even with much higher added taxes! Simply Amazing!
A lot depends on which state you are in but on average yes. The U.S. has also become energy independent which is also a factor.
Here’s a thought…If you remember gas prices less than $1, you’re probably 55 or older. I was born in 1981, and other than a blip in 1998, gas was always more than $1. I vaguely remember my parents filling up, maybe as early as 1989 or 1990, and it seemed it was always $1 and change. Seeing the charts above re-enforce those memories. Granted, there was a dip in the mid 80’s, but its likely not everyone saw those prices
I guess it depends on your location. I am 42 and I got my license in ’93. I almost always was paying less than $1 ($0.87 to $.093) until a year or two after college so about 6 years I think roughly I had where it was very unusual for it to go above $1.
Mike, Yes prices do vary widely based on location (each state charges more or less taxes). The prices you actually paid would be the “nominal” prices. If you had to take today’s money and travel back in time it would cost more because today’s dollars aren’t worth as much because they printed more of them. Those are the ‘inflation-adjusted prices”.
How about showing gas prices without the taxes compared to your nominal price?
Gary, Is Gasoline Taxes by State what you are looking for?
Could you make or show a chart comparison true cost of living since 1900-2017 and cost of gasoline and other things a modern American cannot survive without buying.
Maybe even add in or make another chart showing Min Wage inflation adjust what it’s worth now and then, maybe compare it to Median Income to show the true destruction of America which started in the 1990s and will NOT end.
Pedro,
Thanks for the comment. Over the years we have done comparisons between the cost of living 100 years ago and now. Like Food Price Inflation Since 1913, Its Weight in Gold: The Real Prices of Things and The Real Basket of Goods. Hope this helps!
Sorry, my friend, but the ‘true destruction of America’ started in the 1980s with the failed ‘social engineering’ policies of Ronald Reagan. He almost single-handedly decimated the middle class. His ‘trickle down’ voodoo economics, major cuts to higher education, destruction of the unions and financial deregulation have demonstrably lead to the disastrous situation we have today. Look it up if you don’t believe it. #BelieveIt
Ronald Reagan saved us from Jimmy Carter. Thank God for the Gipper!
absolutely right Tom! The Reagan years were the best financial years for my family. Made some excellent choices (guesses?!) in my younger years, and my grandkids won’t know enough to thank me. I took a big hit during the end of Bush years, and obama almost finished America. President Trump greased the wheels and got the economy rolling strong again. #TrumpTrain
Odd. I remember the Regan years as “a lot of nasl’y talk, no action”. Followed up with the lame Bushes #1 & #2, Then Trump by the time he got in there I saw it for what it was a war on anybody no white with some police butt kissing in there (police lives matter) for good measure. So now with covid shortages I just smile & go home & boil my potatoes.
Well, I guess a lot depends on your perception. But if we look at strictly the numbers we see the sharpest drop in the misery index early in the Reagan Presidency. https://inflationdata.com/articles/wp-content/uploads/2021/11/Misery-Index-Nov-2021.png
Agree! One of the best presidents!
Rik Wild is correct.
Ronald Reagan was the worst president in the US, until Trump.
His policies led to the rich getting richer, the poor getting poorer, and the middle class shrinking.
Maybe the Misery Index should have a longer term perspective.
Roger, We run the misery index all the way back to 1948 and the biggest drop was under Reagan. And it was doing well under Trump until COVID.
https://inflationdata.com/articles/wp-content/uploads/2022/05/Misery-Index-w-Presidents-May-2022.png
Tim,
What I am saying is that whatever Reagan or Dishonest Donald did may have had a temporary impact, the Misery Index does not take into account the long-term misery their actions precipitated.
Would be.nice to know how many industrial plants their was then and now. Might be surprised to know that their aren’t any new ones that I know of.
Since at least 1990 when NAFTA was signed manufacturing jobs have been moving overseas. We began shifting toward Computer based jobs so it is misguided to count “industrial plants” since they are no longer the basis of our economy. We have left the industrial age, passed through the information age and are now entering the post information age.
But in answer to your question what about all the plants Elon Musk is creating, Tesla, and the “Switch data center” which covers a massive 6.5 million square feet? Space-X? Powerwall? SolarCity? That’s just Elon. How about all the projects by Bezos, Page, Adelson, Ellison, Gates and don’t forget Steve Jobs.
I don’t know where you got your prices from, but, when I was growing up I can remember when the gas prices fell from $0.17 a gallon to $0.07 a gallon in the late 1950’s. In the mid 1960’s It only cost $2.00 to $5.00 to fill up your car and the tanks at that time were between 20 gallons to 25 gallons.
Remember these are Nationwide averages, prices varied widely based on State Highway taxes. And you have to look at the “Nominal Price” not the inflation adjusted price. My first car was a 1962 Chevy Impala with a 20 gallon tank and I was lucky to get 10 miles per gallon which gave the car a 200 mile range maximum. The lowest price I remember was $0.29 in 1964 which meshes well with the data which says it averaged $0.30. Gasoline price data comes from the USEIA. http://www.eia.gov/petroleum/data.cfm#prices
Would be interesting perhaps to create a “cost of driving” index for motorists (or for truckers, using diesel price); the index would relate US avg. gasoline price to avg. fleet fuel economy, and would show “miles per dollar” ….
But should it count just marginal costs (gas, tires, oil) or Average Total Costs (including depreciation, insurance, licensing fee & taxes)?
For truckers, it is not just diesel; do not forget diesel exhaust fluid (DEF). This is a significant cost that did not exist until 10 or 20 years ago. Farmers have to buy it now, all the shippers, …
Their goal has always been to make travel unaffordable for us “lesser beings”.
Editor’s note: It requires roughly 2-4 oz of DEF for each gallon of diesel a truck burns. For more info:
https://kus-usa.com/resources/what-is-diesel-exhaust-fluid/
Some experts claim that DEF and SCR engines get better MPG so it may actually save money.
https://www.enginebuildermag.com/2013/08/survey-finds-diesel-exhaust-fluids-def-impact-on-fuel-economy-a-top-concern/