How do Inflation and recession correlate?
Does high inflation correspond with a recession? Or does high inflation precede a recession?
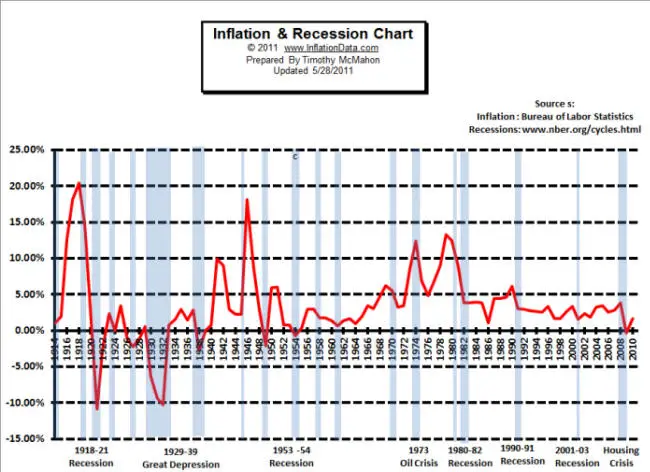
This chart shows the historical average Annual Inflation rate (red line) compared to the time periods where the country was in recession (blue shaded areas).
(click
on chart for larger image)
Subscribe to our FREE monthly E-Zine and we
will notify you when this chart has been updated!
Webmasters if you would like to use any of our
charts please check our
usage policy
Since 1914 there have been eight recessions. Three lasted for a single year, (in 1953, 1957 and again in 1990). The longest recession was actually the "Great Depression" which lasted ten years from 1929 to 1939.
Before looking at this chart of the relationship between Inflation and recession you might think that as inflation rises costs would be getting higher and so people would be unable to afford goods and the economy would fall into recession.
 And
that is exactly what happened during the 1973
Oil crisis.
This resulted in a recession which lasted two years
from 1973 through 1975. Basically, as OPEC drastically
raised oil prices it put a drain on the economy which
resulted in an inflationary recession.
And
that is exactly what happened during the 1973
Oil crisis.
This resulted in a recession which lasted two years
from 1973 through 1975. Basically, as OPEC drastically
raised oil prices it put a drain on the economy which
resulted in an inflationary recession.
But this is not the norm. Looking at the post World War 1 recession from 1918 - 1921 we see a sharp drop in inflation from +20% to -10% during the three year recession.
The great depression is synonymous with deflation (or falling prices) during the first half prices fell 10% a year by the end prices were rising in the 2-3% a year range but then in 1938 prices lost 2-3% again.
During the 1953 recession prices were falling very slightly with inflation moving from slightly above 0% to slightly below.
The 1957 recession saw slightly declining inflation rates but the inflation rate didn't turn into actual falling prices. All that happened was that the rate of inflation fell slightly from around 3% to around 2%.
In the 1980 - 1982 recession inflation fell very sharply from around 13% to under 4%.
And in the 1990 - 1991 recession inflation fell about 2 points from just above 5%. And finally in the 2001 - 2003 recession inflation was relatively flat hovering around 3%.
So based on these time periods most recessions saw falling (or negative) inflation rates. But does that mean that falling prices cause recessions.
No not at all.
Generally, stable or gradually decreasing prices are good for the economy but other than the "Great Depression" what we see are high inflation rates prior to the recession which are "wrung" out of the economy by a recession.
We see this prior to 1918 when inflation rates were 20% and in 1980 they were over 13%. So how do we explain the other examples that weren't so high?
The "Great Depression" was actually an example of fiscal mismanagement as the government clamped down on the money supply too tightly in an attempt at fiscal responsibility.
The 1953 recession was once again caused by the government clamping down on the money supply in an effort to wring the almost 6% inflation out of the economy. Unfortunately they over did it a bit which resulted in the one year recession.
Monetary policy was tightened during the two years preceding 1957, followed by an easing of policy at the end of 1957.
The 1980 recession was closely related to the 1973 Oil embargo recession because the Iranian Revolution sharply increased the price of oil around the world in 1979, causing the 1979 energy crisis. This sucked capital out of the system causing both recessions.
On "Black Monday" of October 1987 a stock collapse lopped 22.6 percent off the Dow Jones Industrial Average. The collapse which was larger than that of 1929, drastically decreased the money supply and although the economy quickly began to recover it was hit by the one-two punch of the savings and loans collapse which sent the economy into a tailspin. See A Detailed Timeline of the 2008 Financial Crisis for more information.
So this was once again a result of a collapse of liquidity in the system.
The 2001 - 2003 recession was similarly caused by a contraction of liquidity after a stock market bubble this time the result of excess liquidity created by the FED flowing into the new "DotCom" stocks. When this bubble burst it drastically reduced liquidity once again sending the economy into a tailspin.
The most recent recession officially lasted from December 2007 through June of 2009 or roughly a year and a half. However, as of this writing two years after the official end of the recession, unemployment rates are still hovering between 9% and 10%. This recession was precipitated by an easy lending policy on the part of the Government through the "Fannie Mae" and "Freddie Mac" programs which created a massive housing bubble which threatened the entire financial system when it popped.
Recessions although painful serve a useful purpose by wringing out excess liquidity out of the system and returning the economy to a more stable footing.
The key of course for individuals is to not get caught up in the excesses that precede the recession so they can weather the storm once it arrives.
So does high inflation cause a recession? In a way yes, but it precedes the recession. Usually, high inflation corresponds with liquidity creation and a booming economy. But after a while the party balloon can get no bigger and it eventually bursts. Liquidity contracts, inflation falls and the economy contracts into a recession.
That is exactly what we are seeing now. The money supply is beginning to contract and the economy is sinking into recession. See the article M3 Money Supply is Back.
For more information on Inflation Planning:
See our Compound Inflation Calculator aka. Retirement Planning Calculator
How much do you need to earn next year to keep up with inflation? See our Salary Inflation Calculator to find out.
Has this information been helpful? We appreciate your feedback.
 Connect with Tim on
 Use our custom search to find more articles like this

Share Your Thoughts